This article describes how to measure a pulse-width-modulated (PWM) signal using the Pokit Meter device.
The Pokit Meter is a very small digital multimeter (DMM) like device that can be interfaced over Bluetooth Low Energy (BLE). Due to its design and small form factor it comes with many limitations, but it's good enough for some measurements, is relatively inexpensive (90 € or so) and is very portable.
The vendor also provides an Android application which (as of 2022-06) is good enough for occasional measurements, but contains too many paper cuts, sadly.
Besides the usual functions that are expected from an entry level DMM (limited to a lower range) and a logger mode, it supports an oscilloscope (DSO) mode.
Of course, the DSO mode is also very limited, most notably it doesn't support continuous data acquisition. However, its bandwidth is good enough for sampling 1000 data points at a rate of 1 Mhz from a low-level logic signal (i.e. over a period of 1 ms). Which is good enough for e.g. measuring a 40 kHz PWM signal as used in IR consumer remote protocols.
Besides plotting the sampled signal, the Pokit Android software also supports computing its frequency and duty cycle. Unfortunately, these functions are buggy (as of 2022-06), such that every few times the wrong frequency is displayed (i.e. it's doubled), such that one basically has to repeat a measurement several times and take a majority vote ... Example (correct frequency is 40 kHz):
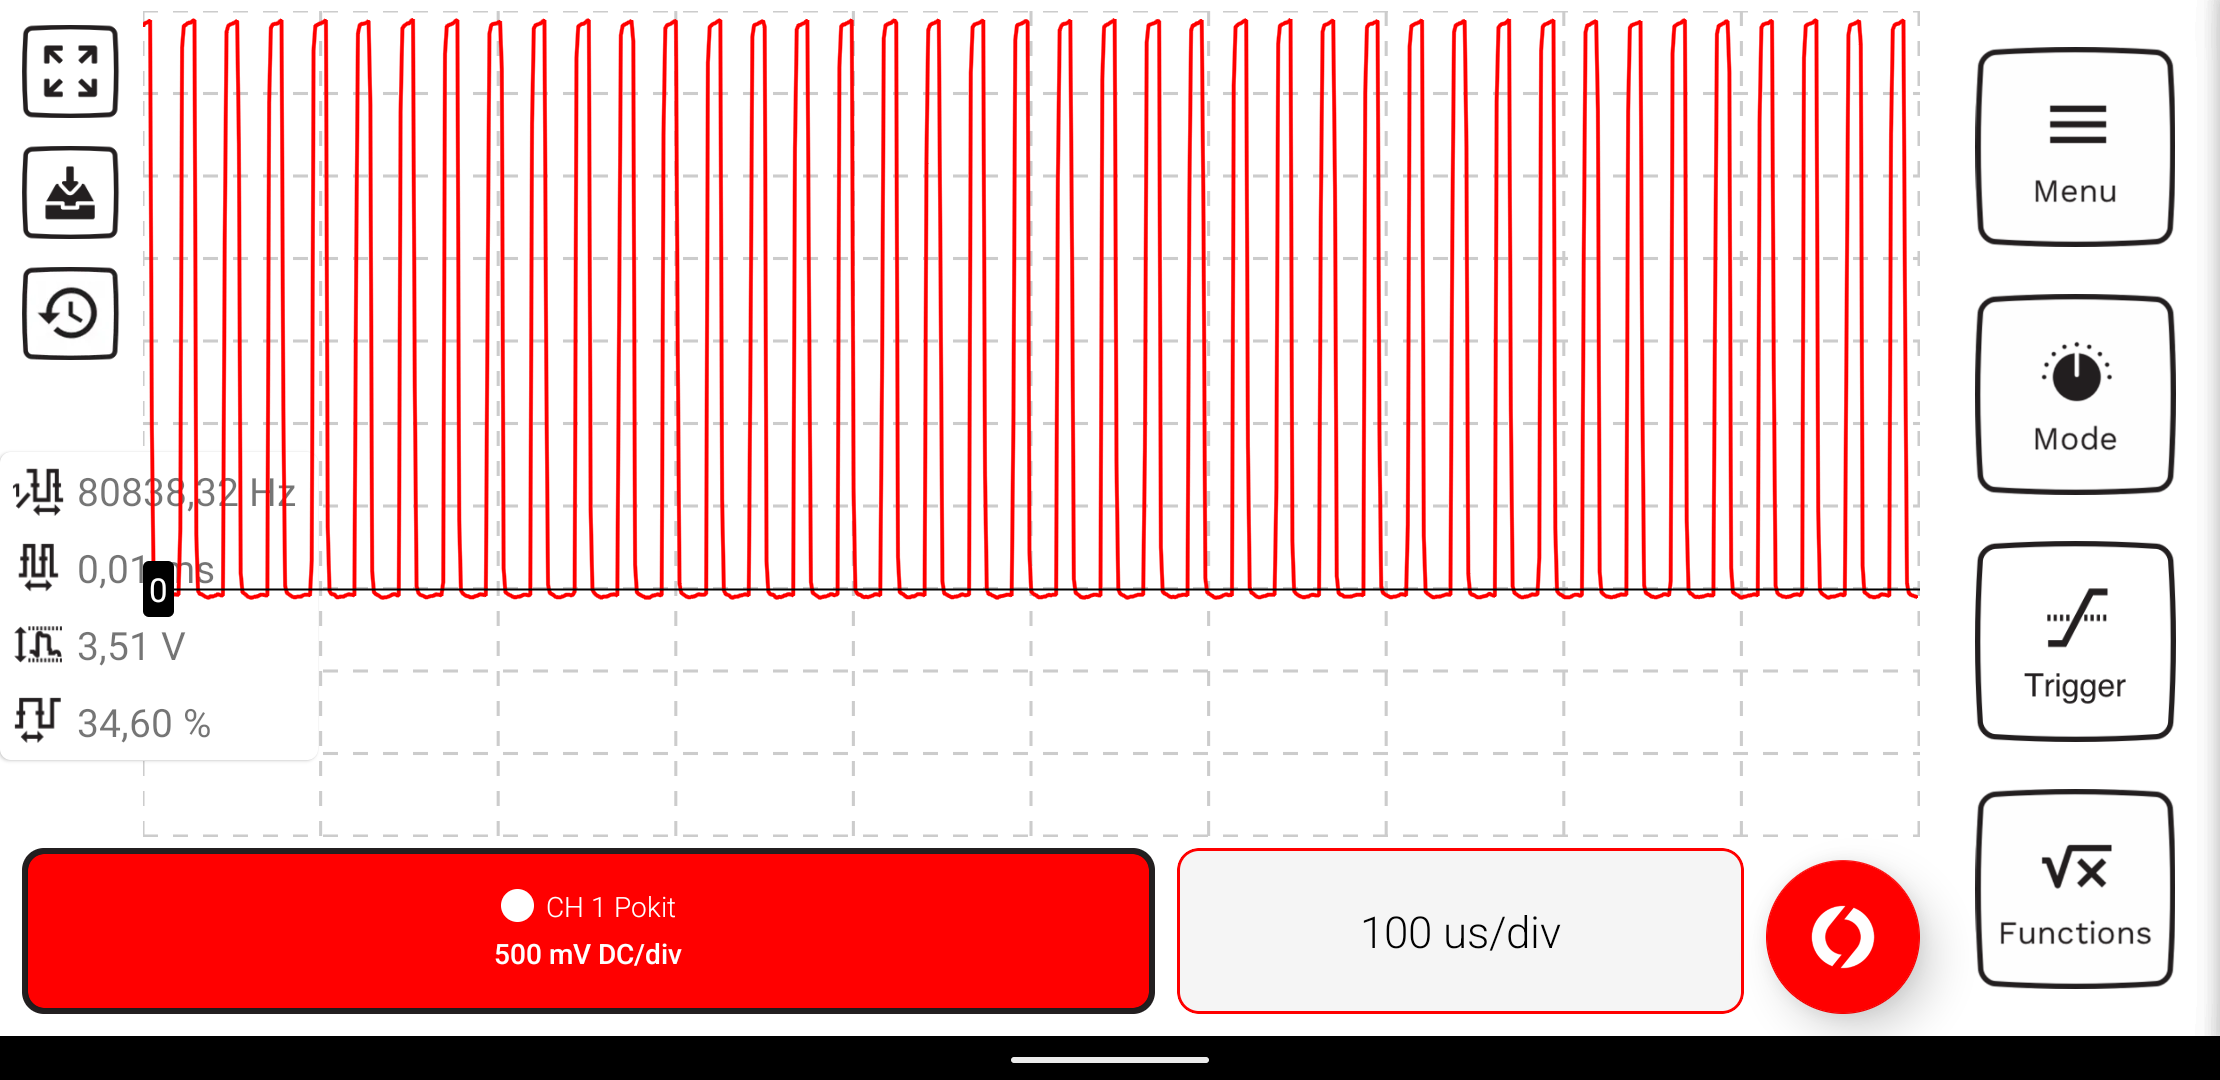
However, the graph still looks fine. So it seems that the FFT and/or the peak detection the software uses or has implemented contains a bug.
I thus exported the raw data of a few measurements (including series where the bug wasn't triggered) and analyzed them with Scipy, Numpy, Pandas and Seaborn. See also the last section for details (i.e. it's my exported Jupyter Notebook).
Summary: The signal looks good in all cases and there really aren't any unexpected issues with the results of the FFT such as the spectrogram. Thus, even when using a simple peak detection 'algorithm' there is aren't any challenges to reliably detect the signal's main frequency, programmatically.
Which increases the suspicion that the wrong frequency display is entirely caused by a bug in Polkit's Android software.
Pokit Meter Specifications
Since the Pokit specifications require some scrolling on the product page, I also include them here:
DMM:
- Voltage: 10 mV to 42 V AC (True RMS) 10 mV to 60 VDC +- 1%
- Current: 1 mA to 2 A AC (True RMS)/DC +- 1%
- Resistance: 100 mΩ to 1 MΩ +- 5%
- Temp: 0 to 60 C +- 1 C
- Diode: 0 V - 1.0 V (Check Only)
- Input Impedance(DC): 1MΩ
- Continuity Check
- Continuity Check Delay (200 ms max)
- Continuity Buzzer (via phone)
- True RMS
DSO:
- Voltage: 10 mV to 42 V AC 10 mV to 60 VDC +- 1%
- Current: 1 mA to 2 A AC/DC +- 1%
- Input Impedance (DC): 1 MΩ
- Sampling: 12bit, 1 M samples/s
Logger:
- Voltage: 10 mV to 42V AC (True RMS) 10 mV to 60 VDC +- 1%
- Current: 1 mA to 2A AC (True RMS)/DC +- 1%
- Temp: 0 to 60 C +- 1 C
- Memory: 128 KB, i.e. 1 sample/45 minutes (-> up to 6 Months that way)
- Sample Rate: 1 s to 18 h
- Input Impedance(DC): 1 MΩ
- True RMS
Of course, other 'real' DMMs have better specs and also specify them more detailed. Especially with respect to the accuracy and resolution of the different ranges.
These specifications leave it open up to which frequency True RMS AC measurement is supported. I did a quick test, and the results for a 40 kHz signal were way off. For comparison, the datasheet of the EEVBlog 121GW DMM specifies AC coupled RMS mode up to 5 kHz and DC coupled RMS mode up to 1 kHz.
Notably, the Pokit Meter doesn't support DC coupled RMS measurments.
Burden Voltage
Also, Pokit doesn't specify any burden voltages for current measurements (unlike other DMMs). I measured an internal resistance of 22.35 Ohm at the 10 mA current range which results in a burden voltage of 22 mV/mA.
Of course, this isn't particularly impressive, as might be expected from the other specs. For example, even a 25 year old ultra cheap DMM of mine has half of that burden voltage.
Paper Cuts
As mentioned in the introduction, the Pokit Android software comes with too many annoyances, as of 2022. Even after playing with it for only a few minutes, one easily notices several of them.
Most notable issues:
- DSO mode is immediately terminated (and all settings are lost) when quickly switching to another app, e.g. even when just sharing a measurement from history or a screenshot
- many settings aren't retained when switching between DSO and DMM mode, or when exiting the DSO mode, such as position of the x-axis, selected functions, etc.
- there is no way to lock the time/unit division (div) such that it's easily changed by accident to nonsensical decimal divisions
- some settings can only be set by tedious zooming gestures, there is no direct discrete entry possible
- graph isn't automatically vertically shifted when there aren't negative values
- there is no snap-to-grid feature
- there are no labels on the axes
- functions are positioned suboptimally such that they are often unreadable
- DFT just shows histogram, no spectrogram
- placing measurement tips doesn't work, as a side effect the graph isn't displayed anymore, even on follow up measurements. Workaround: switch between modes to reset and thus lose again all the settings ...
Arguably somewhat less notable:
- the application doesn't support Dark Mode
The device itself has to make some compromises because of its form factor. However, the quality of the J-probes could be better. For example, with my device, the black one gets stuck when being retracted.
On the positive side, some pros:
- device is ultra portable and relatively inexpensive
- the device's BLE protocol is openly documented
- if nothing else is available, it's definitely good enough for reverse-engineering or verifying some PWM signals
Alternatives
Obvious alternatives are to use a 'real' DMM with better specs for the usual measurements, and a real oscilloscope/logic-analyzer for looking at PWM signals, especially if longer periods need to be observed. See for example the Sigrok device support page to get an idea of typical devices in different device classes that also can be interfaced by an computer (and support continuous data acquisition).
Some mid-level DMMs also support a frequency measurement mode, where the frequency and even the duty cycle can be measured. However, a look at the datasheet is mandatory, since the DMM likely isn't able to sample the signal fast enough, it isn't sensitive enough for common logic-levels, only supports frequency measurements of AC voltages etc.
For a first approximation, a better DMM might be used to verify a regular PWM signal even without a dedicated frequency mode, at least for doing some plausibility checks. For example, one can calculate the expected average DC voltage, AC coupled and DC couples RMS voltages and see if the DMM measured values match the expectation. Also, the True RMS AC mode might be sensitive/fast enough to even display the logic-level PWM frequency, correctly. However, even with better DMMs the True RMS sampling might not be high enough for some PWM signals (check the datasheet).
If the DMM specs are sparse and details regarding various measurement modes are lacking, one should look for a better device.
Notebook
%matplotlib inline
import pandas as pd
import numpy as np
import seaborn as sns
import matplotlib.pyplot as plt
import scipy.signal
plt.rcParams['figure.figsize']
[6.4, 4.8]
sns.set(rc={'figure.figsize':(8, 4)})
sns.set_style("darkgrid")
{ k: v for k, v in sns.axes_style().items() if "color" in k }
{'axes.facecolor': '#EAEAF2',
 'axes.edgecolor': 'white',
 'axes.labelcolor': '.15',
 'figure.facecolor': 'white',
 'grid.color': 'white',
 'text.color': '.15',
 'xtick.color': '.15',
 'ytick.color': '.15',
 'patch.edgecolor': 'w',
 'patch.force_edgecolor': True}
custom_style = {
    'axes.labelcolor': 'white',
    'xtick.color': 'white',
    'ytick.color': 'white',
    'figure.facecolor': '#282e36',
    'axes.facecolor': '#282e36',
    'grid.color': '#2f363f',
    'axes.edgecolor': '#2f363f',
}
sns.set_style("darkgrid", rc=custom_style)
sns.set_palette('pastel')
sns.color_palette('pastel')
def read_pokit_dso(filename):
    df = pd.read_csv(filename, skiprows=8, usecols=[0,1])
    df.rename({'Time (s)': 'timestamp_ms', 'CH 1 - Pokit (V DC)': 'V'},  axis=1, inplace=True)
    return df
def read_sample_freq(filename):
    df = pd.read_csv(filename, skiprows=2, nrows=1)
    d = df['Duration'][0]
    if not d.endswith('ms'):
        raise RuntimeError(f'Unknown unit in: {d}')
    d = float(d.replace(',', '.')[:-2])
    n = df['# Samples'][0]
    f = 1000.0 / d * n
    return f
#filename = 'Pokit DSO Export 2022-06-16 19-05-04.csv'
#filename = 'Pokit DSO Export 2022-06-16 19-05-13.csv'
#filename = 'Pokit DSO Export 2022-06-18 20-42-40.csv'
filename = 'Pokit DSO Export 2022-06-19 15-16-33.csv'
sample_freq = read_sample_freq(filename)
sample_freq
1000000.0
The example CSV originate from measuring a GPIO pin of an Arduino Mini Pro 3.3V (8 MHz) that is configured for fast PWM (i.e. its Timer2 is set to mode 7) at ~ 40 kHz with a duty cycle of ~ 33 %.
IOW, it's configured with:
OCR2A   = 200;
OCR2B   = 66;
TCCR2A  = _BV(WGM21) | _BV(WGM20);
TCCR2B  = _BV(WGM22);
TCCR2B |= _BV(CS20);
df = read_pokit_dso(filename)
df
| timestamp_ms | V | |
|---|---|---|
| 0 | 0.000 | 3.409125 |
| 1 | 0.001 | 2.087047 |
| 2 | 0.002 | 0.096353 |
| 3 | 0.003 | 0.013272 |
| 4 | 0.004 | 0.005748 |
| ... | ... | ... |
| 995 | 0.995 | 0.020796 |
| 996 | 0.996 | 0.005748 |
| 997 | 0.997 | -0.001777 |
| 998 | 0.998 | -0.009301 |
| 999 | 0.999 | -0.013063 |
1000 rows × 2 columns
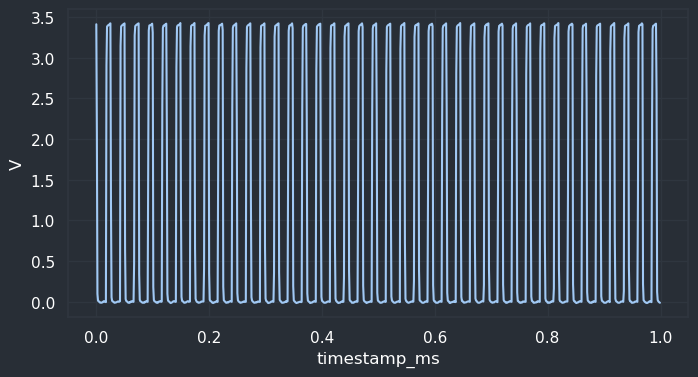
sns.lineplot(data=df, x='timestamp_ms', y='V', palette='bright')
<AxesSubplot:xlabel='timestamp_ms', ylabel='V'>
V_max = df.V.max()
V_min = df.V.min()
V_pp = V_max - V_min
(V_min, V_max, V_pp)
(-0.0168251227587461, 3.424278497695923, 3.441103620454669)
duty_cycle = df.V.mean()/df.V.max() * 100.0
duty_cycle
33.010387910119036
sns.histplot(data=df, x='V')
<AxesSubplot:xlabel='V', ylabel='Count'>
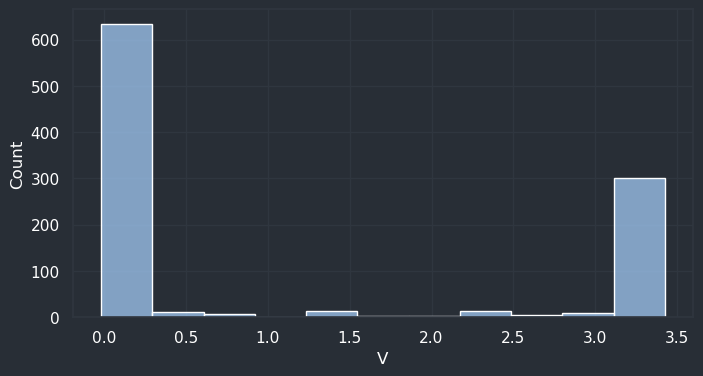
vs = np.histogram(df.V, bins=2)
duty_cycleP = vs[0][1] / sum(vs[0]) * 100.0
duty_cycleP
33.0
f, t, xs = scipy.signal.spectrogram(df.V, fs=sample_freq)
That means scipy.signal.spectogram() returns an array of frequencies (y-axis), an array of time segments (x-axis) and an 2D array of amplitudes (the color).
t
array([0.000128, 0.000352, 0.000576, 0.0008 ])
len(f)
129
xs.shape
(129, 4)
xs[:3]
array([[3.83836353e-08, 8.26500290e-08, 2.77362553e-07, 3.39608196e-07],
       [7.44573266e-09, 1.56151258e-08, 7.45418394e-09, 3.61549100e-09],
       [2.69642610e-08, 1.45100991e-07, 2.17451029e-07, 9.25996058e-08]])
xs.flatten().min(), xs.flatten().max()
(2.9019512920648874e-11, 0.0003120145689393602)
vs = xs.sum(axis=1)
sns.lineplot(x=f, y=vs)
<AxesSubplot:>
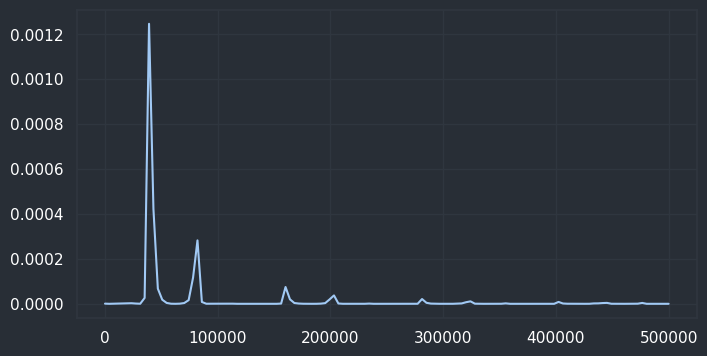
freq = f[vs.argmax()]
freq
39062.5
xs.argmax(axis=0)
array([10, 10, 10, 10])
freq = np.mean([f[i] for i in xs.argmax(axis=0)])
freq
39062.5
def normalize(xs):
    xs = xs.copy()
    xs -= xs.min()
    xs /= xs.max()
    xs *= 100.0
    return xs
cmap = plt.colormaps['inferno']
fig = plt.pcolormesh(t, f, normalize(xs), shading='gouraud', cmap=cmap)
plt.colorbar(fig)
plt.ylim(0, freq * 3.0)
plt.ylabel('Frequency [Hz]')
plt.xlabel('Time [sec]')
plt.show()
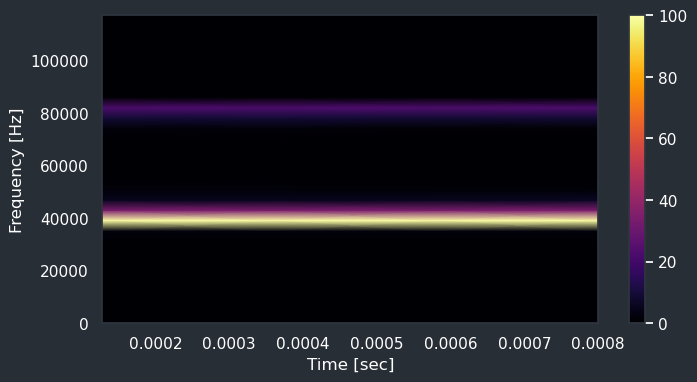
As expected, such a spectogram also contains (faint) multiples of the main frequency. Here we can see one at 80 kHz or so.
Perhaps the Pokit Android app has a bug in its FFT code such that it sometimes misses the main frequency and settles for the next multiple.
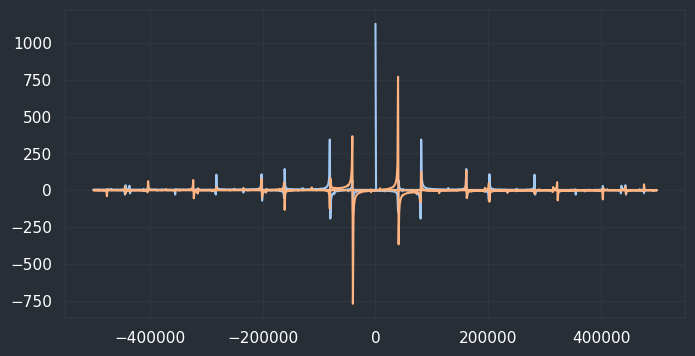
Looing into the FFT in more detail:
sp = np.fft.fft(df.V)
x_freqs = np.fft.fftfreq(df.V.shape[-1], 1/sample_freq)
#plt.xlim(-freq * 3.0, freq * 3.0)
#plt.xlim(38000, freq * 3.0)
plt.plot(x_freqs, sp.real, x_freqs, sp.imag)
[<matplotlib.lines.Line2D at 0x7f8322ab33a0>,
 <matplotlib.lines.Line2D at 0x7f8322ab33d0>]
Compute magnitudes:
ms = np.sqrt(sp.real**2 + sp.imag**2)
plt.xlim(1000, freq * 3.0)
sns.lineplot(x=x_freqs, y=ms)
<AxesSubplot:>
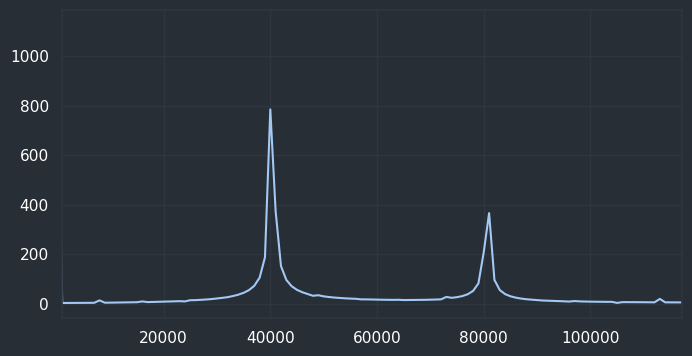
x_freqs[ms[1:].argmax()+1]
40000.0